Resveratrol Figuras
6 figuras de investigación revisada por expertos
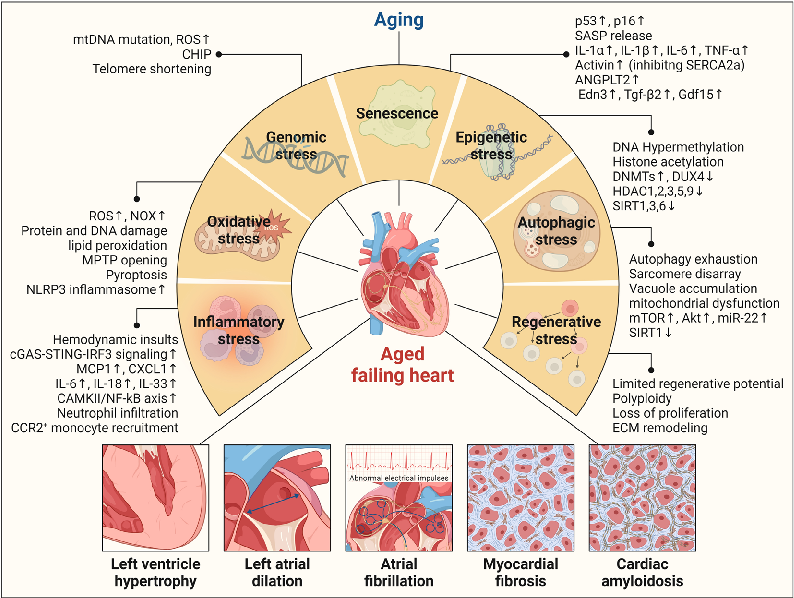
Comprehensive diagram of cardiac aging mechanisms leading to heart failure, depicting how genomic, epigenetic, oxidative, autophagic, and inflammatory stresses drive structural changes including left ventricular hypertrophy and myocardial fibrosis.
Systemic aging fuels heart failure: Molecular mechanisms and therapeutic avenues.
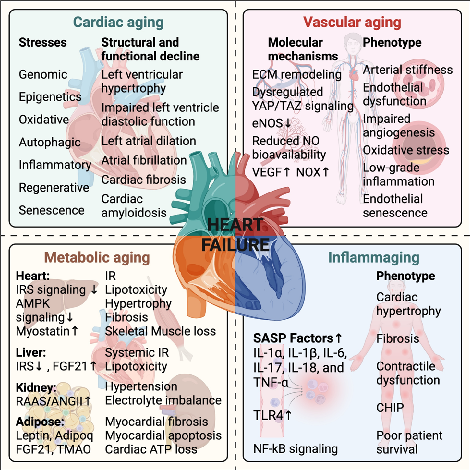
Systemic aging pathways fueling heart failure, summarizing cardiac, vascular, metabolic, and inflammaging mechanisms alongside their associated molecular changes and clinical phenotypes.
Systemic aging fuels heart failure: Molecular mechanisms and therapeutic avenues.
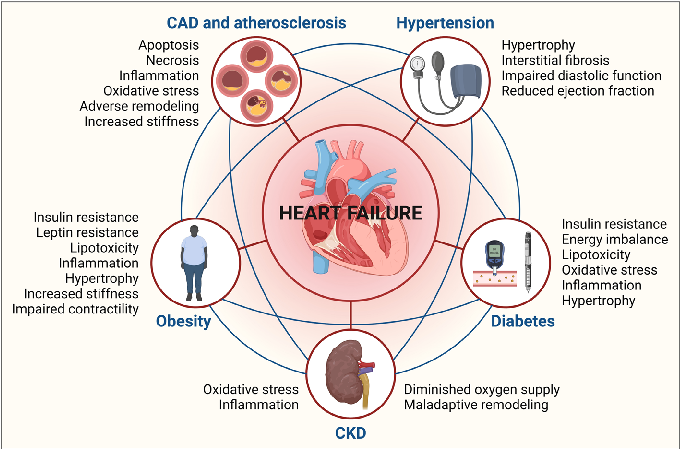
Molecular mechanisms or therapeutic targets related to age-associated heart failure, covering topics such as senescent cell accumulation, RAAS dysregulation, and potential anti-aging interventions.
Systemic aging fuels heart failure: Molecular mechanisms and therapeutic avenues.
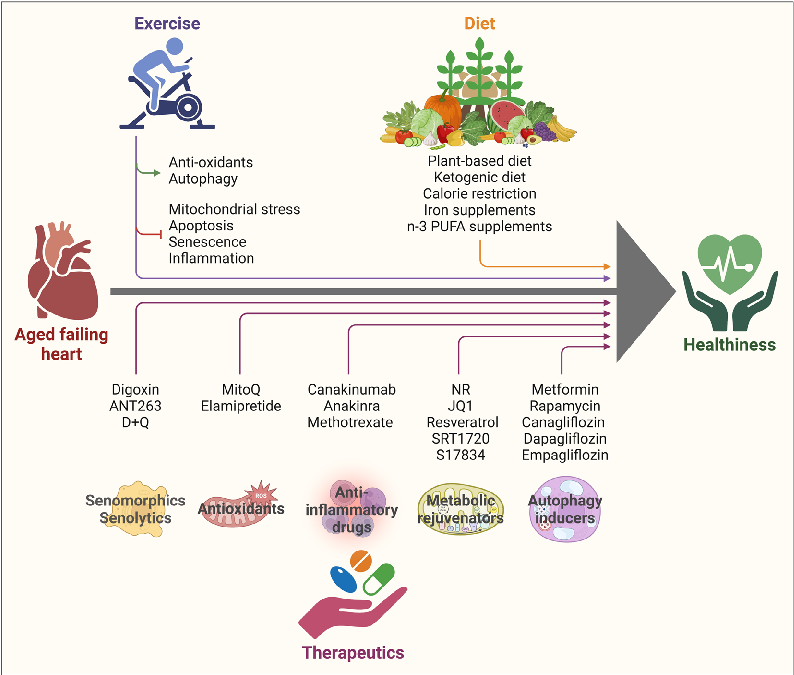
Molecular mechanisms or therapeutic targets related to age-associated heart failure, covering topics such as senescent cell accumulation, RAAS dysregulation, and potential anti-aging interventions.
Systemic aging fuels heart failure: Molecular mechanisms and therapeutic avenues.
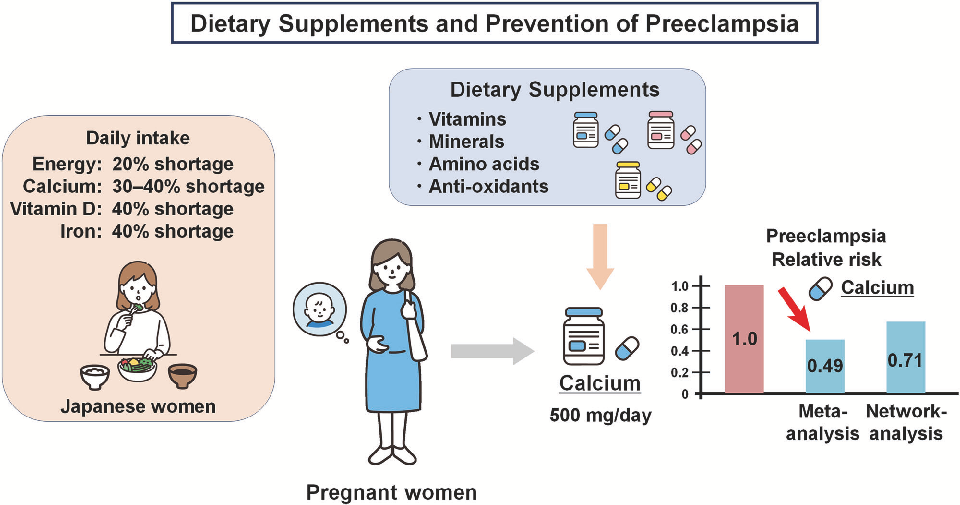
Statistical analysis from research investigating dietary supplements and prevention of preeclampsia, comparing treatment groups and control conditions.
Dietary supplements and prevention of preeclampsia.
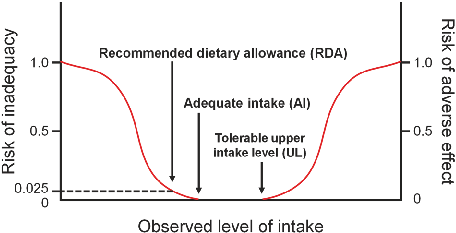
Fig. 1 Dietary reference intakes.
Dietary supplements and prevention of preeclampsia.