Berberine Figuras
5 figuras de investigación revisada por expertos
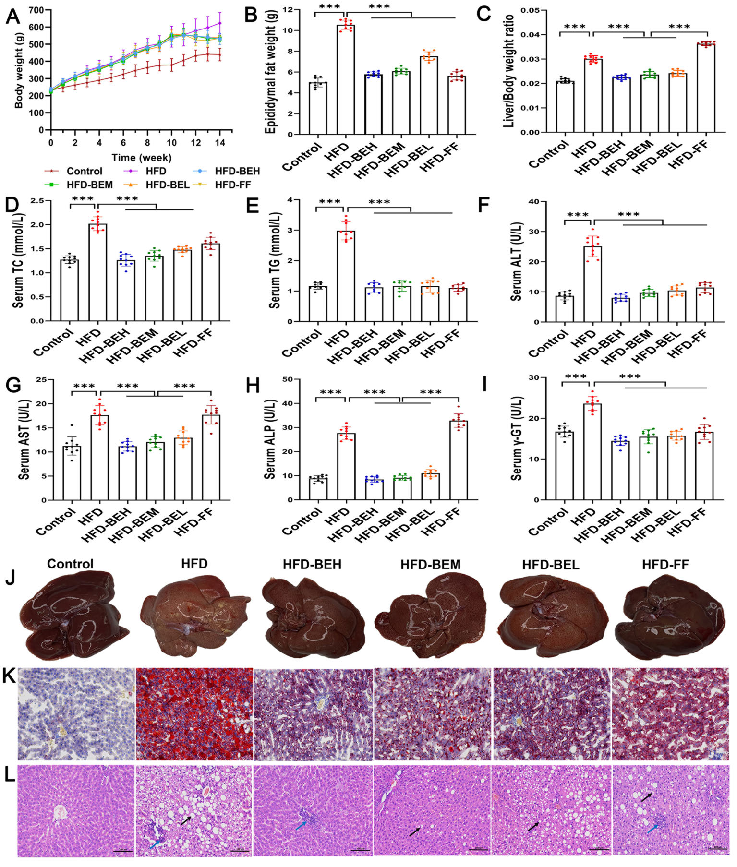
Gut microbiota composition analyzed by 16S rRNA sequencing reveals distinct community structures across treatment groups, with the combination therapy restoring microbial diversity.
The combination of berberine and evodiamine ameliorates high-fat diet-induced non-alcoholic fatty liver …
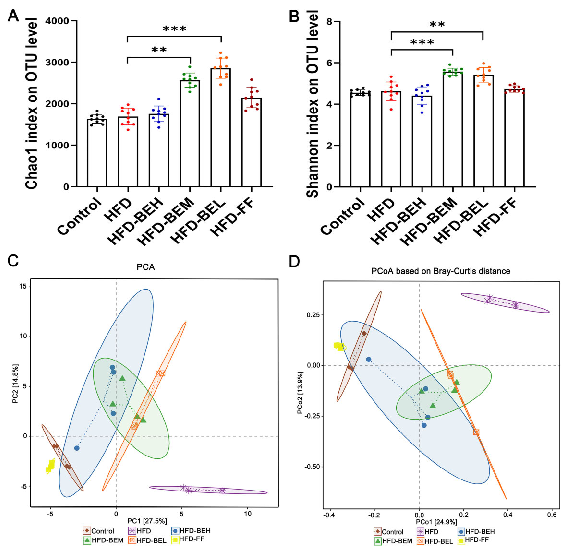
Alpha diversity indices of gut microbiota are compared across groups, indicating that berberine and evodiamine co-administration partially reverses high-fat diet-induced dysbiosis.
The combination of berberine and evodiamine ameliorates high-fat diet-induced non-alcoholic fatty liver …
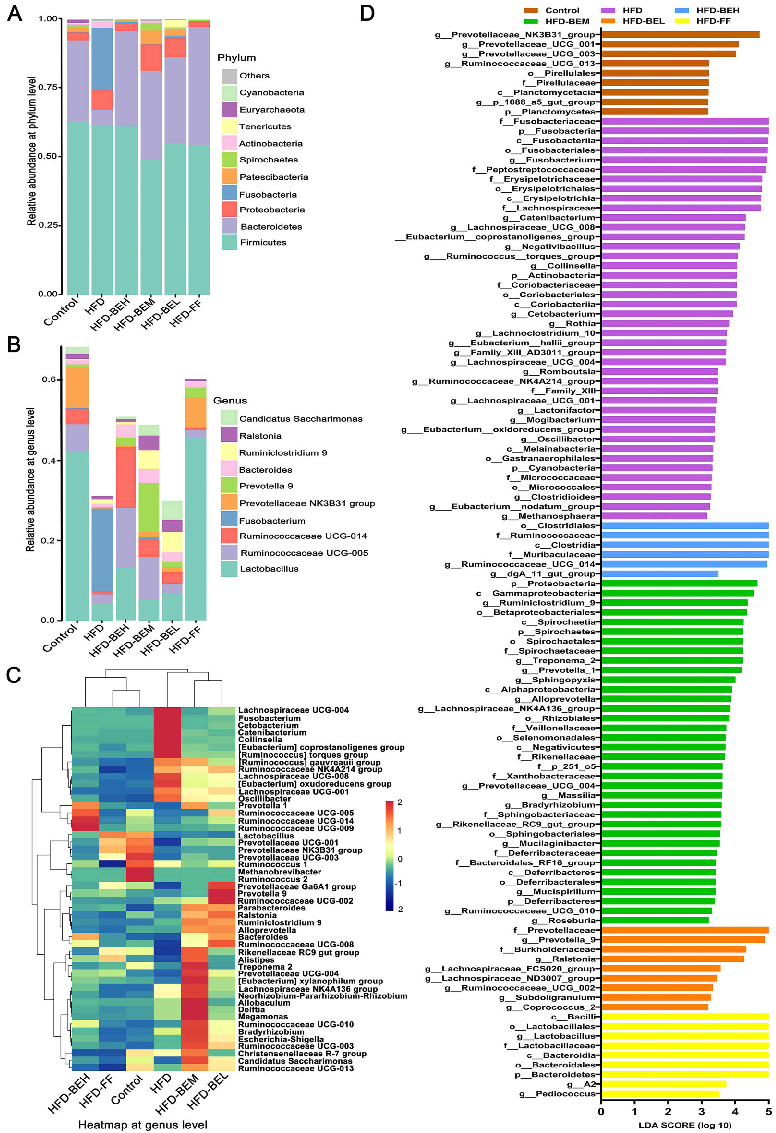
Key bacterial taxa differentially abundant between treatment groups are identified, with specific genera associated with improved metabolic outcomes in the combination therapy arm.
The combination of berberine and evodiamine ameliorates high-fat diet-induced non-alcoholic fatty liver …
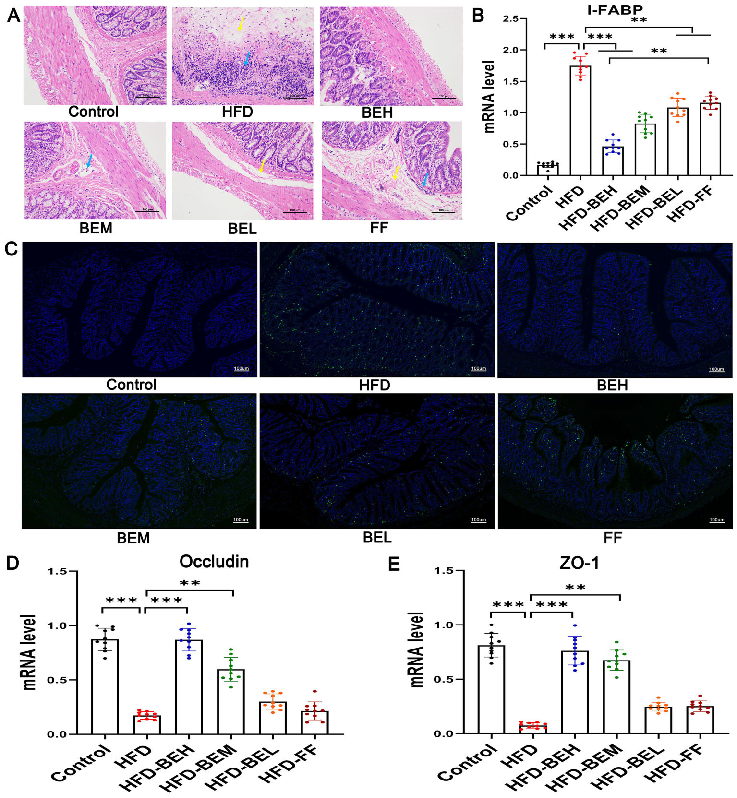
Short-chain fatty acid concentrations in fecal samples reflect changes in microbial metabolic activity following berberine and evodiamine treatment.
The combination of berberine and evodiamine ameliorates high-fat diet-induced non-alcoholic fatty liver …
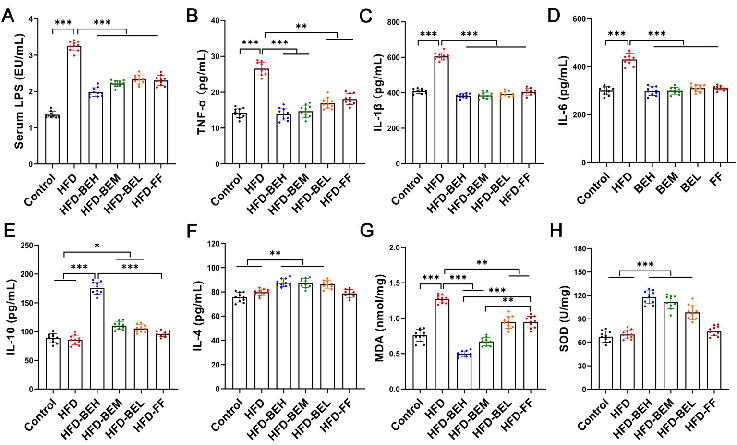
Correlation analysis between gut microbiota composition and hepatic lipid parameters links specific bacterial taxa to the amelioration of non-alcoholic fatty liver disease.
The combination of berberine and evodiamine ameliorates high-fat diet-induced non-alcoholic fatty liver …